
It has taken me two years, many, many iterations, and countless hours of mental anguish, but I think I've finally settled on a reliable method by which I can evaluate any quarterback's passing ability versus any other quarterback's passing ability regardless of when they played, or for how long they played. So, for example, I can compare Peyton Manning versus Sammy Baugh, or, Otto Graham versus Brett Favre, or, Sonny Jurgensen versus Dan Marino. You get the point. It all started coming together for me as I wrote my post on Manning versus Brees versus Favre. While I had already figured out how to effectively compare one quarterback's given season to that of another's given season, I had as yet to figure out an effective method by which we evaluated careers.
The inspiration came to me as I read Michael J. Schell's book, Baseball's All-Time Best Hitters, where he went about solving a different problem altogether, but had essentially the same characteristics of the problem I was trying to solve. He was trying to account for the fact that for many hitters with long careers, their batting averages declined after they reached their mid-thirties. And, he didn't think it was fair to compare a hitter who had played into their late thirties or early forties to a player that had not. He chose to account for this by using a "late career adjustment". What he did was to look only at a player's first 8,000 at-bats.
I adopted this notion, and, instead of using a player's first x years, came up with the idea of using his best x years, given that a player's passing ability, as measured by CMTI, and compared to that of his peers tends to be a little volatile from year to year.
Deciding what x was going to be was an issue. I wanted to balance outstanding achievement with duration. In other words, I wanted to see who had performed at an exceedingly high level for a long time. Remember, from my previous post, the average number of years a quarterback qualifies is 4.125. The median is 3.
I thought that a good starting point was to use 4 years. This measure would include 169 players, or a little more than 40% of my database of 416 players going back to when the NFL officially started keeping statistics, and including both the AAFC in the 1940's and the AFL in the 1960's.
If I used 7 years, then I'd get 95 players, or almost 25% of the total. That seemed reasonable for a couple of reasons. First, 25% seemed like a good cut-off, albeit arbitrary. Second, it would allow me to discard the worst years for those quarterbacks who had 8 or more years, which seemed like an appropriate way to reward longevity.
I could have looked at 10 years - in which case, we would be limiting ourselves to 50 quarterbacks, or about 12% of the database, a rather small group, and, as we shall see, excluding many superb passers who didn't quite make it to 10 years. Keep in mind that the median number of years a player qualifies, is 3 years.
My basic method for evaluating a player's performance in a given year is to look at his CMTI, and then, based on the mean and standard deviation for that given year, relate his performance to that of his peers. Since the aggregate accumulation of these measures over the past 78 years looks very much like a normal (bell-shaped) curve, we can use the bell-curve to convert these measures to percentile ranks, giving a numerical value ranging from 1 to 99 for each of these performances. The sum of a given quarterback's 4 best such performances are then used as my C4 calculation, and the sum of his 7 best performances are my C7 calculation. Obviously, then the maximum possible value for C4 is 99 * 4 = 396, and, commensurately, the maximum C7 value is 99 * 7 = 693. As I mentioned earlier, I've also calculated a C10 value for those players with an exceptionally long career. Obviously, if we did this for every year a player qualified, one could create a career C score for each player.
Let's take a look at the lists. We will start with C4.
Wow! What a list. Not bad for starters. Remember, this is a ranking based on a quarterback's 4 best years as a passer. Look at the top 14 on this list. 12 of them are in the Pro Football Hall of Fame! Peyton Manning surely will be when he is done. That's 13 out of 14! Ken Anderson ranks 3rd all-time as a passer according to this list. It is important to keep in mind that this is a list of the top-ranked passers, not top-ranked quarterbacks. It is hard enought to determine a ranking of passers, so it would stand to reason then that it is much harder to determine what makes a top-ranked quarterback. I don't know how the NFL goes about determining who gets in to the Hall of Fame and who deos not, but it sure seems odd that Ken Anderson is the only player in the top 14 on this list that isn't (assuming that Peyton is in, of course).
One of the most aesthetically pleasing aspects of this list, especially looking at the top 15, is that every era and every decade is represented. There does not seem to be a bias. I would think that is an admirable quality of any top-ranked list in that it shows that the measure used to determine who is better, isn't necessarily biased towards a particular era - as opposed to say, the list of top ranked passers (see here and here) in terms of the NFL Passer Rating system at the Pro-Football Hall of Fame.
Look at Steve Young's C4. That's almost unbelievable! The highest C4 possible is 396. In other words, that is being in the 99th percentile four years. Well, Young comes close. His 1996 and 1997 seasons were in the 99th percentile, and his 1992 and 1994 seasons were in the 98th percentile.
In my previous post, we discussed Kurt Warner's merits as a passer. We ignored any discussion about whether he will be enshrined in Canton. Based on this list, it would appear that he is right on the fence.
There are a total of 27 quarterbacks on this list that are members of the Hall of Fame. There are a total of 31 quarterbacks that have been inducted into the Hall of Fame. The four that are in the Hall of Fame, but are not on this list are omitted for good reason. They all played in the 'early years' of the NFL - prior to the keeping of official statistics. They are, Jimmy Conzelman, who played from 1921-1929, John (Paddy) Driscoll, who played from 1920-1929, Earl (Dutch) Clark, who played from 1931-1938 and actually had two very good years in 1934 and 1936, and Benny Friedman, who played from 1927-1934, and who, many during his time argued was the finest passer of his time. It is most unfortunate that we don't have official statistics that would show that.
OK, what about C7?
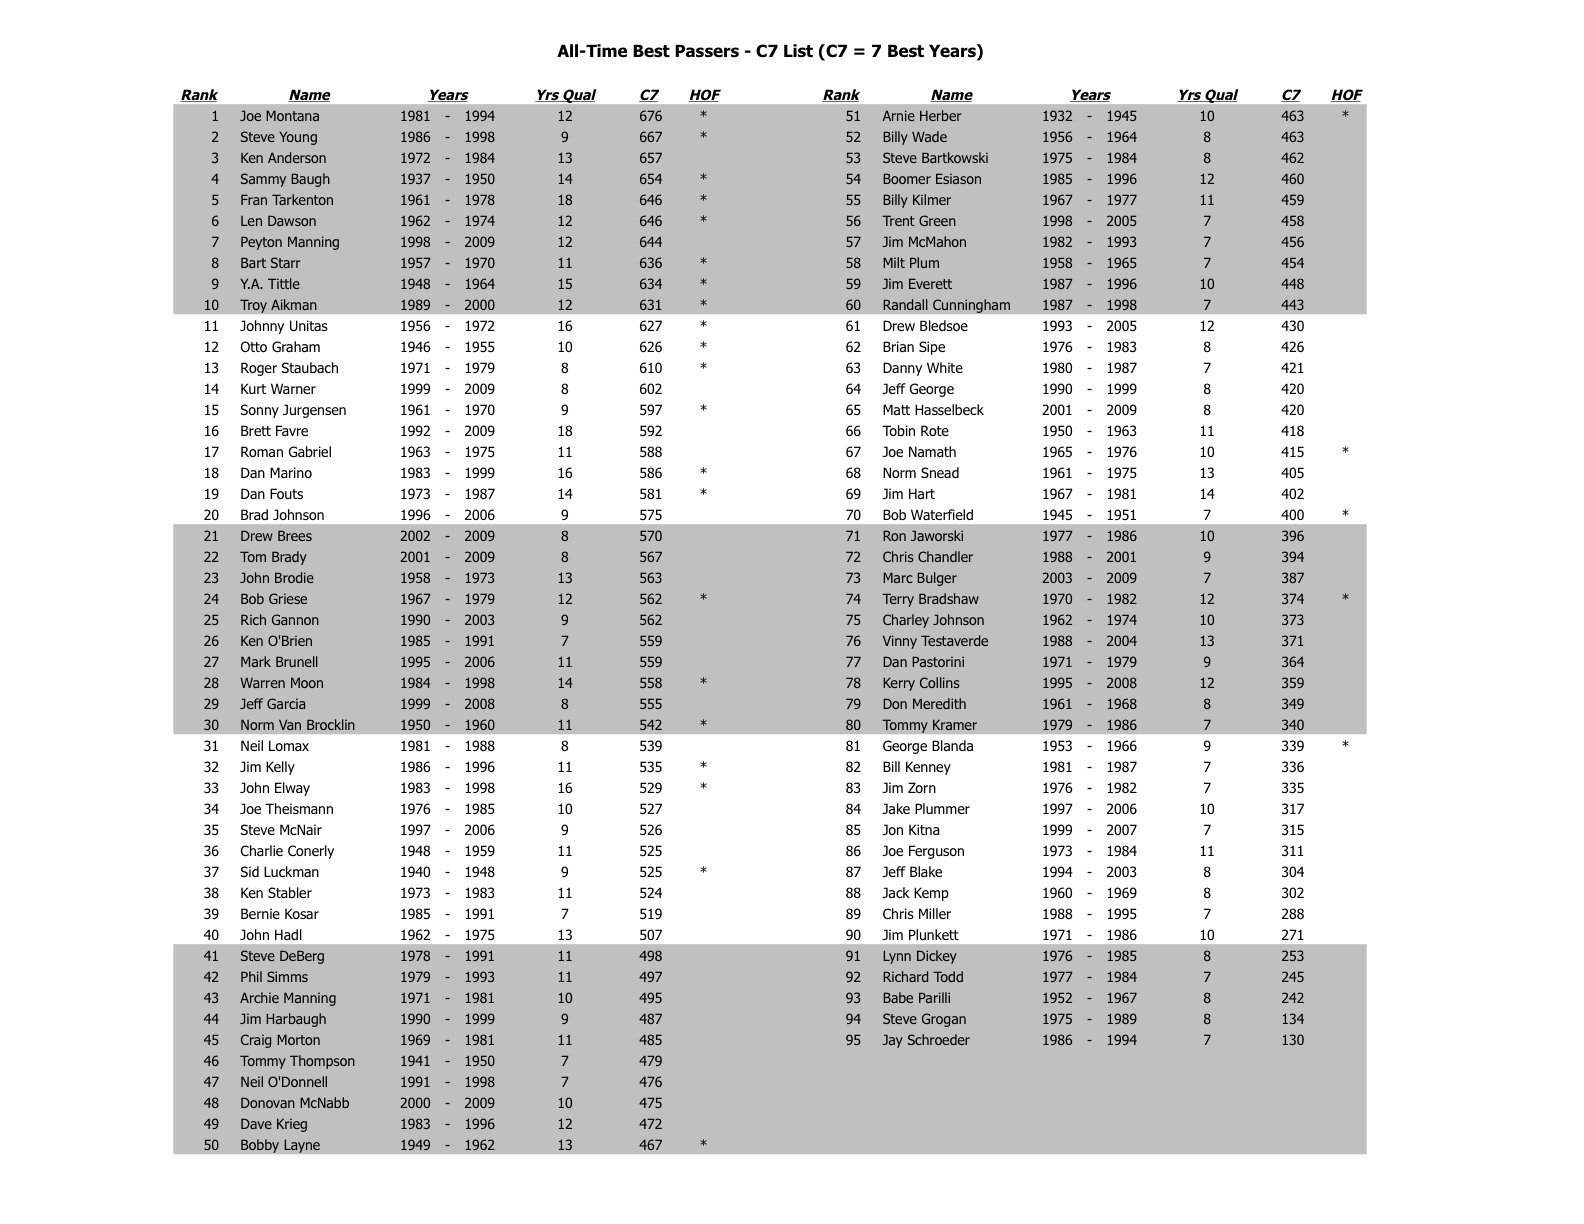
Woah! An even better list than C4! First, while the ordering changed, the top 15 stayed exactly the same as the C4 list, which probably suggests more of the power of the C4 list than anything else (in other words, a quarterback's best 4 years is a pretty good indicator of their passing ability). However, now, we not only have 13 of the top 15 in the HOF (I am considering it a foregone conclusion that Peyton Manning will be inducted into the HOF), but 16 of the top 20 are either in the Hall of Fame or will be (I am also considering it a foregone conclusion that Brett Favre will also be inducted into the HOF). That is a phenomenal list.
It seems obvious then, that, in order to be inducted into the Hall of Fame as a quarterback, one must also have been a great passer. Having said that, it's even more shocking to me now the omission of Ken Anderson from the HOF. I simply do not understand why he is not in. I will have to post an article on Ken Anderson in the near future.
What does C7 say about Kurt Warner? Again, right on the fence.
From my vantage point, it certainly appears that we should be discussing putting Ken Anderson in the Hall of Fame ahead of Kurt Warner.
Finally, we'll take a look at C10. This list only includes 50 quarterbacks, and many exceptional passers are not on this list, simply because they didn't qualify in at least 10 years.
The story is similar to what we've already seen with the C4 and C7 lists. 14 of the top 15 (if you include Peyton Manning and Brett Favre as in the Hall of Fame) are or will be in the Hall of Fame. The lone exception is - you guessed it - Ken Anderson.
There's several conclusions that I can draw from all of this.
I feel pretty good that I've come up with a method by which I can determine the all-time best passers in the history of professional football. I also feel that this method will stand the test of time. It will work regardless of how the game changes over time. It is a method that allows me to conveniently compare players who played in different eras, and it allows me to compare players who have had different career lengths.
Although being inducted into the Hall of Fame as a quarterback shouldn't be a criterion by which we evaluate a quarterback's passing ability, it does provide a reasonableness check of the method I've employed. Given the likelihood of being in the Hall of Fame and showing up at the top of these lists, one could theoretically use it as a measure of whether a quarterback will be inducted into the Hall of Fame. Obviously, there are other factors that enter that equation, but, I can draw some conclusions as to what might be necessary as a passer to be considered a good candidate for the Hall.
A C4 score of 370 or better is a must to be a shoo-in for the Hall. The caveat there being the quarterback would have to had at least 8 seasons where they qualified. Looking at C7, I'd say a C7 score of 625 or better is a requirement, although a score of 600 or better conceivably also works. A C10 score of 775 or better would be considered a must to have any chance of being inducted into the Hall of Fame (in my opinion anyway).
As I mentioned earlier in the article, I think C4 doesn't consider enough years. Conversely, I think C10 is too exclusive. C7 is a good compromise. I could have created a C8 or C6, but C7 feels like it strikes the right balance between excellence and longevity. From now on, I will use C7 as the standard measure of a player's career passing prowess, although I may use C4 and C10 where appropriate. For example, if a player does not have a C7 score, I may use C4 as an early gauge, or, I may use C10 to compare to passers who have had lengthy careers.
Well, now that we've developed the method by which we can fairly present any quarterback's career as a passer, the natural question is, who is the greatest passer of all-time? My method (C7) would suggest it is Joe Montana. Steve Young would come in a close second. You could also look at C4, and you'd see that they are the top 2, although in reverse order. How good Joe Montana was, and for how long he performed at an incredibly high level, is evident by looking at C10 scores. He is the only passer in the history of professional football to have a C10 score exceeding 900, and, at 939, he is 50 ahead of Peyton Manning.
A quick digression here, in case it wasn't obvious. C scores can never decrease, only increase. So for example, Peyton Manning's scores can only increase from here on out. Since we consider a player's best years, if a subsequent year for a player isn't one of the best that already was included in the score, then it wouldn't count towards that score. It would only count if it exceeded, and thereby replaced, one of the years already included. Since Peyton's 10th best season so far is a 79 (his performance in 2007 was in the 79th percentile), he would have to have a performance better than that in the future to increase his C10 score (I would consider that quite likely). On the other hand, his 7th best season is an 85 (his 2009 season), and I'd say that he's only about 50/50 to improve upon that, and thereby increase his C7 score (and if he did improve upon that, he would also improve his C10 score).
So, of the current crop of players, who might eventually knock on the door of the Hall of Fame? Drew Brees and Tom Brady are currently ranked 21 and 22 on the C7 list with scores of 570 and 567, respectively. A few more good years, and they would move up the ladder. For example, in the case of Drew Brees, his score of 570 is made up of scores of 93, 93, 89, 88, 77, 75 and 55. It's almost a guarantee that he would end up dropping the 55. I think it's a foregone conclusion that his C7 score will eventually exceed 600 by a comfortable margin. What about Brady? Well, he is probably already a shoo-in for the Hall on account of his three Super Bowl victories. But, as a passer, he appears a lot weaker than Brees. Brady's C7 score of 567 is made up of scores of 98, 89, 80, 76, 75, 75, and 74. Given his history, I don't see him improving too much from the 567. Perhaps when it is all said and done, he might end up in the 580-590 range. One never knows though.
What about the next generation of passers? Who might be good candidates to have great careers as passers? Chad Pennington, whose current C4 score is 366, one less than that of Kurt Warner, is an interesting case. However, given his history of injuries, he may not be able to accumulate a solid C7 score. If he has one decent year, say, in the 70th percentile, then his C7 score would be 575. There are two players that I think could potentially have great careers based on their current C4 scores - Carson Palmer and Philip Rivers. Based on their yearly scores, I think Philip Rivers might be the better bet, even though Palmer currently has the higher C4 score. Interestingly, Philip Rivers currently ranks 2nd to Steve Young on the all-time passer rating list. Of those who don't even have a C4 score, Matt Schaub has shown excellent early potential.
Showing posts with label CMTI. Show all posts
Monday, April 26, 2010
Tuesday, March 9, 2010
A Look Back At Kurt Warner's Career As a Passer
On the Friday before Superbowl XLIV, Kurt Warner announced that he was retiring from the NFL.
Of course, the conversations now turn to whether he will be enshrined in Canton. There are those who say yes, some who say maybe, and those who say no. The fact is, we don't know. There is no formula to get in.
In many of the posts on the topic, the usual comparisons are made. The easiest comparisons are to his peers - Manning, Brady, Favre, Brees, and others. The other comparisons I've seen are to players like Dan Fouts, Jim Kelly, Troy Aikman, and Warren Moon, all four of whom are in Canton.
My post is not about whether he was a good quarterback or not, and whether he should or should not be in the Hall of Fame. This post is about whether or not he was a good passer. And how did he compare to his peers? And where would he rank in terms of recent quarterbacks who have retired? And how would he compare to all quarterbacks? These are the questions I will explore. All of these questions will be answered in the context of his passing ability in relation to the others.
Ok, let's start with a look back at his performance over the years.
Several things jump out at me.
His career passer rating, for one. It's very high. According to the Pro Football Hall of Fame, Warner's career passer rating of 93.7 ranks fifth best all-time, behind Steve Young, Philip Rivers, Tony Romo and Peyton Manning. As I have discussed before, the NFL passer rating formula isn't a very meaningful way to compare quarterbacks over time. I'll discuss how we adjust the passer rating, and even simplify it, and then compare that figure to his peers, in order to get a more meaningful picture. The average passer rating of 95.1 shown above differs from that shown by the Pro Football Hall of Fame simply because mine is just a simple average of each year.
Another fact that jumps out at me is that he got a late start. He didn't start really playing until he was 28. In my database of 416 quarterbacks going all the way back to 1932, including players from both the AAFC in the late 1940's and the AFL in the 1960's, and only looking at quarterbacks who have qualified in 8 or more years, only 7 quarterbacks had their first qualifying season at age 28 or later. For all quarterbacks who qualified in at least 8 seasons, both the median and mean age at which they qualified in their first season is 24. There are a total of 77 quarterbacks who qualified in at least 8 seasons. Keep in mind that the average number of years in which a quarterback qualifies (given that he qualifies in at least 1 year) is 4.125, and median number of years is 3. So to be one of only 7 quarterbacks who began at age 28 or later and qualify in 8 different seasons is pretty rare company. The other six players are Jeff Garcia and Roger Staubach at age 29, and Warren Moon, Billy Kilmer, Ken Stabler, and Brad Johnson at age 28. Note that Staubach and Moon are both in the Hall of Fame.
Next thing I notice is that there are many gaps in his career. He got injured, then was signed by the NY Giants as an insurance policy against Eli Manning. Following that, he ended up getting an opportunity to play in Arizona, until the Cardinals drafted Matt Leinart. When Leinart got hurt in the fifth game of the 2007 season, Kurt stepped in, and went on to lead the Cardinals into Superbowl XLIII, and into the playoffs this past season, where the Cardinals lost to eventual Superbowl Champs New Orleans.
It is extremely difficult to use the NFL Passer Rating system, especially the career passer rating for a given quarterback to see how they compare to other quarterbacks. Just take a look at the list provided by the Pro Football Hall of Fame. This is simply not a list of the best passers over time. It merely reflects the fact that the passer rating calculation favors current passers. I have previously shown (here) why this is not an accurate reflection of passing ability.
Perhaps one way to adjust the passer rating is to reflect the standards such that the average in each year turns out to be 66.7 (as the intended application of the passer rating). See my post on the subject here. In that regard, Warner's (adjusted) career passer rating is around 83. Of the 416 quarterbacks, that would rank him 23rd. Of the quarterbacks qualifying in 8 or more years, it would rank him 10th.
While the Adjusted Passer Rating is better than the NFL Passer Rating, in that at least one can compare quarterbacks from one era with those of another, it's still not an ideal (or simple) measure of a passer's effectiveness. I've used CMTI in the past, and I'll use it here. More specifically, I'll use the CMTIPR, or percentile rank of CMTI.
In my previous post, I compared Manning, Favre and Brees using CMTIPR. We had to adjust CMTIPR for length of career, and I used their best seasons as the measure. At the end of that post, a graphical illustration showed the effect. I've since improved upon that concept. Using the concept of "Best Seasons", I've come up with 4 statistical measures, C1, C4, C7 and C10, that basically shows a given quarterback's best season (C1), 4 best seasons (C4), 7 best seasons (C7) and 10 best seasons (C10). C1 is simply the quarterback's best season in terms of percentile rank of CMTI. C4 is similarly the sum of the percentile ranks of his 4 best seasons, and so on.
So let's take a look at Warner, and how he compares to Manning, Favre, and Brees.
Obviously, neither Brees nor Warner will have a C10 score as they've not had 10 seasons in which they qualified. I don't think one can evaluate a career based on 1 year, so let's not use C1. It is shown simply for illustration purposes to highlight their best year. So that leaves us with C4 or C7. In order to truly define greatness, one must exemplify superior performance, but also perform at that level for a number of years. The more years performing at a high level, the greater the player. I think that C7 strikes a good balance. In my database, there are 50 quarterbacks who have a C10 score, 95 quarterbacks who have a C7 score, and 169 quarterbacks who have a C4 score. So, at least based on a C7 score, Warner compares very favorably to Manning, Favre and Brees.
We will go into much more details regarding the C scores for quarterbacks in my next post.
Of course, the conversations now turn to whether he will be enshrined in Canton. There are those who say yes, some who say maybe, and those who say no. The fact is, we don't know. There is no formula to get in.
In many of the posts on the topic, the usual comparisons are made. The easiest comparisons are to his peers - Manning, Brady, Favre, Brees, and others. The other comparisons I've seen are to players like Dan Fouts, Jim Kelly, Troy Aikman, and Warren Moon, all four of whom are in Canton.
My post is not about whether he was a good quarterback or not, and whether he should or should not be in the Hall of Fame. This post is about whether or not he was a good passer. And how did he compare to his peers? And where would he rank in terms of recent quarterbacks who have retired? And how would he compare to all quarterbacks? These are the questions I will explore. All of these questions will be answered in the context of his passing ability in relation to the others.
Ok, let's start with a look back at his performance over the years.
Several things jump out at me.
His career passer rating, for one. It's very high. According to the Pro Football Hall of Fame, Warner's career passer rating of 93.7 ranks fifth best all-time, behind Steve Young, Philip Rivers, Tony Romo and Peyton Manning. As I have discussed before, the NFL passer rating formula isn't a very meaningful way to compare quarterbacks over time. I'll discuss how we adjust the passer rating, and even simplify it, and then compare that figure to his peers, in order to get a more meaningful picture. The average passer rating of 95.1 shown above differs from that shown by the Pro Football Hall of Fame simply because mine is just a simple average of each year.
Another fact that jumps out at me is that he got a late start. He didn't start really playing until he was 28. In my database of 416 quarterbacks going all the way back to 1932, including players from both the AAFC in the late 1940's and the AFL in the 1960's, and only looking at quarterbacks who have qualified in 8 or more years, only 7 quarterbacks had their first qualifying season at age 28 or later. For all quarterbacks who qualified in at least 8 seasons, both the median and mean age at which they qualified in their first season is 24. There are a total of 77 quarterbacks who qualified in at least 8 seasons. Keep in mind that the average number of years in which a quarterback qualifies (given that he qualifies in at least 1 year) is 4.125, and median number of years is 3. So to be one of only 7 quarterbacks who began at age 28 or later and qualify in 8 different seasons is pretty rare company. The other six players are Jeff Garcia and Roger Staubach at age 29, and Warren Moon, Billy Kilmer, Ken Stabler, and Brad Johnson at age 28. Note that Staubach and Moon are both in the Hall of Fame.
Next thing I notice is that there are many gaps in his career. He got injured, then was signed by the NY Giants as an insurance policy against Eli Manning. Following that, he ended up getting an opportunity to play in Arizona, until the Cardinals drafted Matt Leinart. When Leinart got hurt in the fifth game of the 2007 season, Kurt stepped in, and went on to lead the Cardinals into Superbowl XLIII, and into the playoffs this past season, where the Cardinals lost to eventual Superbowl Champs New Orleans.
It is extremely difficult to use the NFL Passer Rating system, especially the career passer rating for a given quarterback to see how they compare to other quarterbacks. Just take a look at the list provided by the Pro Football Hall of Fame. This is simply not a list of the best passers over time. It merely reflects the fact that the passer rating calculation favors current passers. I have previously shown (here) why this is not an accurate reflection of passing ability.
Perhaps one way to adjust the passer rating is to reflect the standards such that the average in each year turns out to be 66.7 (as the intended application of the passer rating). See my post on the subject here. In that regard, Warner's (adjusted) career passer rating is around 83. Of the 416 quarterbacks, that would rank him 23rd. Of the quarterbacks qualifying in 8 or more years, it would rank him 10th.
While the Adjusted Passer Rating is better than the NFL Passer Rating, in that at least one can compare quarterbacks from one era with those of another, it's still not an ideal (or simple) measure of a passer's effectiveness. I've used CMTI in the past, and I'll use it here. More specifically, I'll use the CMTIPR, or percentile rank of CMTI.
In my previous post, I compared Manning, Favre and Brees using CMTIPR. We had to adjust CMTIPR for length of career, and I used their best seasons as the measure. At the end of that post, a graphical illustration showed the effect. I've since improved upon that concept. Using the concept of "Best Seasons", I've come up with 4 statistical measures, C1, C4, C7 and C10, that basically shows a given quarterback's best season (C1), 4 best seasons (C4), 7 best seasons (C7) and 10 best seasons (C10). C1 is simply the quarterback's best season in terms of percentile rank of CMTI. C4 is similarly the sum of the percentile ranks of his 4 best seasons, and so on.
So let's take a look at Warner, and how he compares to Manning, Favre, and Brees.
Obviously, neither Brees nor Warner will have a C10 score as they've not had 10 seasons in which they qualified. I don't think one can evaluate a career based on 1 year, so let's not use C1. It is shown simply for illustration purposes to highlight their best year. So that leaves us with C4 or C7. In order to truly define greatness, one must exemplify superior performance, but also perform at that level for a number of years. The more years performing at a high level, the greater the player. I think that C7 strikes a good balance. In my database, there are 50 quarterbacks who have a C10 score, 95 quarterbacks who have a C7 score, and 169 quarterbacks who have a C4 score. So, at least based on a C7 score, Warner compares very favorably to Manning, Favre and Brees.
We will go into much more details regarding the C scores for quarterbacks in my next post.
Sunday, January 31, 2010
Who's Better, Who's Best - Manning, Favre and Brees
Last Sunday we were all treated to some good football. The AFC Championship featured the surprising NY Jets, against the Peyton Manning-led Indianapolis Colts, and the NFC Championship showcased the Drew Brees-led New Orleans Saints who played host to Brett Favre and his Minnesota Vikings.
Not only are these outstanding football teams, but three of the four teams featured three of the game's best quarterbacks in Manning, Favre and Brees. I thought it would be illustrative to take a look at each of the three quarterbacks individually, and then compare the three side by side to get a sense who maybe better, and perhaps even, who may be best. In evaluating their relative merits, I will only consider their ability to throw the football, not win games, or how well they run, or whether they are clutch performers, or how many Super Bowl victories they have.
Here are the career NFL Passer Ratings for these quarterbacks:
Last, we need not assume that the NFL Passer Rating is the measure to be used to evaluate who might be the better passer. The NFL Passer Rating system has a lot of flaws. I will use two measurement methods. The first is the concept of Adjusted Passer Rating. As I have previously mentioned, the average NFL Passer Rating has been steadily increasing every year. The Adjusted Passer Rating normalizes the passer rating so that the average for each year is 66.7. This is then very helpful in evaluating players who played in different years (such as the case here). Last year, I introduced a simple measure of passing efficiency - CMI. I now call this CMTI (or, simplistically, Completions Minus Thrice Interceptions). It is not only simple, but it has a 86% correlation with the NFL Passer Rating. And, because it is so powerful in explaining any variances in the NFL Passer Rating, and because it is so easy to compute, use and explain, I will use it here.
So, to recap, we will make the following adjustments:
Here are the respective #s for each quarterback by season:
Brett Favre
Drew Brees
Peyton Manning
What do these performance measures say? Well, there's a lot of information here, so let's take these one at a time.
The first is that the career averages shown (actually all of the averages shown) are simple arithmetic averages of each of the years, not a true weighted average. You can see that these simple averages are close enough to the true average by looking at the career average NFL passer ratings shown in these three exhibits and compare them to the career average for each of the quarterbacks shown earlier.
The second is that regardless of what measure we use, whether it is the NFL Passer Rating, Adjusted NFL Passer Rating, CMTI, first 8 years, last 12 years or what not, it should be very clear that Peyton Manning has performed at a truly superior level compared to the other 2 players (or anyone else for that matter). Just look at CMTI over the past 8 years, for example. He has averaged being in the 90th percentile over the past 8 years. Basically, that suggests that he is, on average, in the Top 3 every year. Truly remarkable. In Peyton Manning, we are watching one of the all-time best. A once-in-a-generation quarterback. In case you didn't notice, the rows highlighted in green indicate a performance that is in the 85th percentile or higher. The areas in blue are 95th percentile or higher.
Ok, Manning is best. That was easy. Now comes the difficult part. Who's better, Favre or Brees?
The case for Favre:
On an Adjusted Passer Rating basis, Brett Favre's first 8 years are comparable to, if not better than Drew Brees' first 8 years (70th percentile versus 68th percentile). We can't directly compare their two careers since one has had an eighteen year career while the other only eight. It is very evident that, but for the last year, Favre's performance has been quite pedestrian over the past 10 years. Well, we can't necessarily penalize him for that, because we don't know how Brees might do in his next 10 years. We don't even know if he is likely to play another 10 years. Given history, however, it is fairly safe to assume that he won't play another 10 years. In my database, going back to 1932, and including both the AAFC in the 1940's as well as the AFL in the 1960's, I have a total of 416 quarterbacks who qualified in at least 1 year. 206 of these quarterbacks qualified in only 1 or 2 years. The average is 4.125 years. There are only 6 quarterbacks that qualified in 15 or more years. Y.A. Tittle qualified in fifteen different seasons. John Elway, Dan Marino and Johnny Unitas each qualified in sixteen different years. And then there are the ultimate marathon men, Fran Tarkenton and Brett Favre, who both qualified on 18 different occasions.
Michael J. Schell, in his book Baseball's All-Time Best Hitters, makes an adjustment to player batting averages, called a late-career adjustment. In essence, he recognizes that a player's performance declines as he ages, and so he makes an adjustment for it. Schell basically caps the at-bats of a player at 8,000. All at-bats beyond 8,000 are ignored. This way, he can compare each player through their first 8,000 at-bats. Doing that type of adjustment would be extremely difficult in the case of football. We know that the average number of passes attempted by a player per game has increased over time (see here and here), so limiting to a fixed number of attempts would be difficult and meaningless at best.
We could limit the player performances to a given number of seasons. Look at the three graphs below.
The first is the average percentile rank of CMTI for all 416 quarterbacks by age.
And the second is the same as the first, except with the x-axis denoting the number of seasons in which they qualified instead of their age.
It appears that there is a learning curve at first (and an elimination process, as presumably the worst players end up having shorter careers), followed by a decline after about 12 years. Keep in mind that this first graph shows the career percentile rank. What we're really interested in is does performance decline as a player ages? So, what we really want to see is the average percentile rank for a given year of a player's career no matter how long they have played.
This is what the third graph shows. It's actually a bit surprising. There doesn't appear to be a significant drop-off. As a matter of fact, out in the 15th-18th years, their performance seems to have got better! Ok, so in the outer years, we're not talking about a lot of players (for years 17 and 18 its just 2 players - Tarkenton and Favre), so anomalies should be expected. So what do we do?
I mentioned earlier that the average number of years in which a quarterback qualifies is 4.125 for all 416 quarterbacks. The table below shows the data in more detail.
There are a total of 77 quarterbacks who have played (qualified) in 8 or more years. That would be 77/416 = 18.5% of the eligible list. The average number of years for this group is 10.8, and the median number of years for this group is 11. It would seem reasonable then to look at a minimum of 8 years as a cut-off. But how do we recognize players who have played a lot longer? The method that I have chosen is to look at a given player's best 8 years. This means several things. First, the obvious - it eliminates from consideration any player who has qualified in fewer than 8 years. Second, it accounts for the fact that players have played longer, and, that fact doesn't hurt them. As a matter of fact, it's the opposite. The less a player has played, the more the "penalty". Third, given the small sample of players playing beyond 14 years, it is quite possible that one or more of them had good years in those later years, so why exclude those years?
So, going back to the tables where I showed each of the three quarterbacks and their individual seasons, you can see that Favre's best 8 years are better than Brees' 8 years. This gives credit to Favre's lengthy career. Remember, less than 20% of the qualified quarterbacks even get to 8 years total, let alone be fortunate enough to have 8 good years. Perhaps over time, Brees might very well exceed Favre. And, if and when he does, we'll give him credit for it at that time.
The case for Brees:
Although comparable to Favre in his first 8 years based on Adjusted Passer Rating, using CMTI gives Brees the nod. Also notice that Brees has had four years where he was better than 85th percentile, while Favre only had one. Brees' last four years in New Orleans have been especially strong. In each of years 5-8, Brees outperforms Favre, while in the first four, Favre outdoes Brees 3 out of four years. Favre, it appears, built his legend largely on the success of his first year, and perhaps even starting with his first game. Check out the following chart.
It shows the average percentile rank for all quarterbacks who played longer than 8 years, for each year they played. Actually, it's not quite the number of years they played in as much as it is the number of years in which they threw enough passes to qualify to have a rating. It's the blue line, and it includes data from the previously mentioned group of 77 quarterbacks. The blue line in this graph is different than the line shown on the third graph earlier, in that this only includes data for those quarterbacks qualifying in 8 or more years. The red line is the data for Drew Brees. The green line is the data for Favre. Clearly, outside of his first year, and then his 3 MVP years (years 3-5 for him), Favre hugged the average for this group of quarterbacks. Some years he did better, and some he did worse.
We're almost done. One more graph.
This one puts a slight twist on the notion of the best years. Instead of just looking at the best 8 years, why don't we look at the best n years, for each year n that the quarterback has played. So this way, we can look at the best year for each quarterback, the best two years, the best three years, and so on. For good measure, I also threw in Manning's #s.
So what do we conclude from all of this?
Again, if there, was any doubt before, this should put it to rest. Manning is clearly the best.
Between Favre and Brees, an argument could be made for either. In terms of a total career, Favre gets the nod, simply because of the number of years he's played. Brees has put up some impressive numbers so far. If he continues this for a few more years, he will most likely finish ahead of Favre, but that remains to be seen. Based on the evidence so far however, he is doing at least as well as, if not better than Favre did in his first 8 years. Perhaps we'll check-in in a few years when Brees retires. And, speaking of retirement, in my next post, I'll take a look at Kurt Warner's career.
Not only are these outstanding football teams, but three of the four teams featured three of the game's best quarterbacks in Manning, Favre and Brees. I thought it would be illustrative to take a look at each of the three quarterbacks individually, and then compare the three side by side to get a sense who maybe better, and perhaps even, who may be best. In evaluating their relative merits, I will only consider their ability to throw the football, not win games, or how well they run, or whether they are clutch performers, or how many Super Bowl victories they have.
Here are the career NFL Passer Ratings for these quarterbacks:
Manning is clearly the best. Well, at least that's what looking at the career NFL Passer Rating will tell you. These figures differ from what you would find at the Pro Football Hall of Fame (as of January 23rd, 2010). The reason being that the figures listed on the Pro Football Hall of Fame site were as of the beginning of the 2009 season, and mine are as of the end of the 2009 season just completed.
For reasons that I have chronicled in the past (see here, here, and here), the NFL Passer Rating formula is in and of itself is of little use in determining who among the three might be best. The three quarterbacks very well might end up being ranked this way when it is all said and done, but that doesn't justify the rating system.
In order to complete our analysis, we have to make several adjustments to the NFL's passer rating system.
The first, is that we need to take each player's passer rating, and relate it to some baseline, so that we may account for players playing in different eras (yeah, I know, it's a little bit odd to be talking about players in different eras when comparing three current quarterbacks, but Brett Favre has been throwing since 1992, and Drew Brees only since 2002. And since the average NFL passer rating has been increasing over time (see here), we need to make an adjustment for that. The method that I have chosen is to relate a given quarterback's performance relative to the mean for that year, and use the standard deviation in that year as the measuring stick. In other words, the difference between the quarterback's actual performance compared to the mean, as a function of the standard deviation. As I described here, we then convert each of these resulting measures, also called z-values, into percentile ranks, using the standard normal distribution.
The second, is that we need to account for the fact that they've each played a different number of seasons. While I used a rather simplistic approach last year, I will present a more sophisticated approach starting with this blog. This method will need further refinement over time, since I am early in my thought process regarding this particular topic. However, it is an improvement over last year's simplistic approach. Actually, the method used last year (average deviation) really doesn't take into account the number of years at all. When I evaluated Brett Favre's career, I simply compared him to a group of quarterbacks who had played a like number of years, and simply ignored any comparisons to players who played far fewer seasons. That method won't work in this case, as we need to compare three quarterbacks with three vastly different career lengths. All else being equal, and they rarely, if ever, are, a player who has a 10 year career versus a player who has a 7 year career should get a higher rating (even if, and especially if, they both had the exact same ratings in every year they played). But the question becomes, "how much higher"?
The third, is that we need to somehow account for the fact that each of the three quarterbacks has played not only a different number of seasons, but that those seasons represent different parts of their careers. In some respects, since the last 8 seasons have been common to all three, we could simply look at the last 8 seasons. But, that would mean that we would be comparing Brett Favre in his 11th through 18th seasons, Peyton Manning through his 5th through 12th seasons, and Drew Brees his first 8 seasons. As I have shown in the past, the early years for a quarterback tend to be the "learning years", and hence this comparison would be inappropriate without the proper adjustments. Brett Favre is also 40 years old, and we have seen declining performances as quarterbacks age (actually, their performances increase at first as they gain experience, and then subsequently decline as the physical toll takes effect). One method is to look at each player's first 8 years, since in that case the comparisons would be over the identical portions of their careers. And perhaps we could compare Favre and Manning for the first 12 years.
Last, we need not assume that the NFL Passer Rating is the measure to be used to evaluate who might be the better passer. The NFL Passer Rating system has a lot of flaws. I will use two measurement methods. The first is the concept of Adjusted Passer Rating. As I have previously mentioned, the average NFL Passer Rating has been steadily increasing every year. The Adjusted Passer Rating normalizes the passer rating so that the average for each year is 66.7. This is then very helpful in evaluating players who played in different years (such as the case here). Last year, I introduced a simple measure of passing efficiency - CMI. I now call this CMTI (or, simplistically, Completions Minus Thrice Interceptions). It is not only simple, but it has a 86% correlation with the NFL Passer Rating. And, because it is so powerful in explaining any variances in the NFL Passer Rating, and because it is so easy to compute, use and explain, I will use it here.
So, to recap, we will make the following adjustments:
- Relate performance in given year to the mean, and then in relation to standard deviation for that year - then convert to percentile rank
- Use a 'better' measure than NFL Passer Rating. We will show that Adjusted NFL Passer Rating is 'better', and CMTI is simpler
- Take into account differing number of seasons played by each quarterback
- Take into account quarterbacks who are at different stages of their career
Here are the respective #s for each quarterback by season:
Brett Favre
Drew Brees
Peyton Manning
What do these performance measures say? Well, there's a lot of information here, so let's take these one at a time.
The first is that the career averages shown (actually all of the averages shown) are simple arithmetic averages of each of the years, not a true weighted average. You can see that these simple averages are close enough to the true average by looking at the career average NFL passer ratings shown in these three exhibits and compare them to the career average for each of the quarterbacks shown earlier.
The second is that regardless of what measure we use, whether it is the NFL Passer Rating, Adjusted NFL Passer Rating, CMTI, first 8 years, last 12 years or what not, it should be very clear that Peyton Manning has performed at a truly superior level compared to the other 2 players (or anyone else for that matter). Just look at CMTI over the past 8 years, for example. He has averaged being in the 90th percentile over the past 8 years. Basically, that suggests that he is, on average, in the Top 3 every year. Truly remarkable. In Peyton Manning, we are watching one of the all-time best. A once-in-a-generation quarterback. In case you didn't notice, the rows highlighted in green indicate a performance that is in the 85th percentile or higher. The areas in blue are 95th percentile or higher.
Ok, Manning is best. That was easy. Now comes the difficult part. Who's better, Favre or Brees?
The case for Favre:
On an Adjusted Passer Rating basis, Brett Favre's first 8 years are comparable to, if not better than Drew Brees' first 8 years (70th percentile versus 68th percentile). We can't directly compare their two careers since one has had an eighteen year career while the other only eight. It is very evident that, but for the last year, Favre's performance has been quite pedestrian over the past 10 years. Well, we can't necessarily penalize him for that, because we don't know how Brees might do in his next 10 years. We don't even know if he is likely to play another 10 years. Given history, however, it is fairly safe to assume that he won't play another 10 years. In my database, going back to 1932, and including both the AAFC in the 1940's as well as the AFL in the 1960's, I have a total of 416 quarterbacks who qualified in at least 1 year. 206 of these quarterbacks qualified in only 1 or 2 years. The average is 4.125 years. There are only 6 quarterbacks that qualified in 15 or more years. Y.A. Tittle qualified in fifteen different seasons. John Elway, Dan Marino and Johnny Unitas each qualified in sixteen different years. And then there are the ultimate marathon men, Fran Tarkenton and Brett Favre, who both qualified on 18 different occasions.
Michael J. Schell, in his book Baseball's All-Time Best Hitters, makes an adjustment to player batting averages, called a late-career adjustment. In essence, he recognizes that a player's performance declines as he ages, and so he makes an adjustment for it. Schell basically caps the at-bats of a player at 8,000. All at-bats beyond 8,000 are ignored. This way, he can compare each player through their first 8,000 at-bats. Doing that type of adjustment would be extremely difficult in the case of football. We know that the average number of passes attempted by a player per game has increased over time (see here and here), so limiting to a fixed number of attempts would be difficult and meaningless at best.
We could limit the player performances to a given number of seasons. Look at the three graphs below.
The first is the average percentile rank of CMTI for all 416 quarterbacks by age.
And the second is the same as the first, except with the x-axis denoting the number of seasons in which they qualified instead of their age.
It appears that there is a learning curve at first (and an elimination process, as presumably the worst players end up having shorter careers), followed by a decline after about 12 years. Keep in mind that this first graph shows the career percentile rank. What we're really interested in is does performance decline as a player ages? So, what we really want to see is the average percentile rank for a given year of a player's career no matter how long they have played.
This is what the third graph shows. It's actually a bit surprising. There doesn't appear to be a significant drop-off. As a matter of fact, out in the 15th-18th years, their performance seems to have got better! Ok, so in the outer years, we're not talking about a lot of players (for years 17 and 18 its just 2 players - Tarkenton and Favre), so anomalies should be expected. So what do we do?
I mentioned earlier that the average number of years in which a quarterback qualifies is 4.125 for all 416 quarterbacks. The table below shows the data in more detail.
There are a total of 77 quarterbacks who have played (qualified) in 8 or more years. That would be 77/416 = 18.5% of the eligible list. The average number of years for this group is 10.8, and the median number of years for this group is 11. It would seem reasonable then to look at a minimum of 8 years as a cut-off. But how do we recognize players who have played a lot longer? The method that I have chosen is to look at a given player's best 8 years. This means several things. First, the obvious - it eliminates from consideration any player who has qualified in fewer than 8 years. Second, it accounts for the fact that players have played longer, and, that fact doesn't hurt them. As a matter of fact, it's the opposite. The less a player has played, the more the "penalty". Third, given the small sample of players playing beyond 14 years, it is quite possible that one or more of them had good years in those later years, so why exclude those years?
So, going back to the tables where I showed each of the three quarterbacks and their individual seasons, you can see that Favre's best 8 years are better than Brees' 8 years. This gives credit to Favre's lengthy career. Remember, less than 20% of the qualified quarterbacks even get to 8 years total, let alone be fortunate enough to have 8 good years. Perhaps over time, Brees might very well exceed Favre. And, if and when he does, we'll give him credit for it at that time.
The case for Brees:
Although comparable to Favre in his first 8 years based on Adjusted Passer Rating, using CMTI gives Brees the nod. Also notice that Brees has had four years where he was better than 85th percentile, while Favre only had one. Brees' last four years in New Orleans have been especially strong. In each of years 5-8, Brees outperforms Favre, while in the first four, Favre outdoes Brees 3 out of four years. Favre, it appears, built his legend largely on the success of his first year, and perhaps even starting with his first game. Check out the following chart.
It shows the average percentile rank for all quarterbacks who played longer than 8 years, for each year they played. Actually, it's not quite the number of years they played in as much as it is the number of years in which they threw enough passes to qualify to have a rating. It's the blue line, and it includes data from the previously mentioned group of 77 quarterbacks. The blue line in this graph is different than the line shown on the third graph earlier, in that this only includes data for those quarterbacks qualifying in 8 or more years. The red line is the data for Drew Brees. The green line is the data for Favre. Clearly, outside of his first year, and then his 3 MVP years (years 3-5 for him), Favre hugged the average for this group of quarterbacks. Some years he did better, and some he did worse.
We're almost done. One more graph.
This one puts a slight twist on the notion of the best years. Instead of just looking at the best 8 years, why don't we look at the best n years, for each year n that the quarterback has played. So this way, we can look at the best year for each quarterback, the best two years, the best three years, and so on. For good measure, I also threw in Manning's #s.
So what do we conclude from all of this?
Again, if there, was any doubt before, this should put it to rest. Manning is clearly the best.
Between Favre and Brees, an argument could be made for either. In terms of a total career, Favre gets the nod, simply because of the number of years he's played. Brees has put up some impressive numbers so far. If he continues this for a few more years, he will most likely finish ahead of Favre, but that remains to be seen. Based on the evidence so far however, he is doing at least as well as, if not better than Favre did in his first 8 years. Perhaps we'll check-in in a few years when Brees retires. And, speaking of retirement, in my next post, I'll take a look at Kurt Warner's career.
Sunday, January 10, 2010
2009 NFL Season - Passer Ratings
We now have data for the entire 2009 season, and I can calculate the best and worst performers for the season, using my standard measure, CMI - or more appropriately, Standard Deviations from mean CMI. CMI is easily calculated, as it is simply [pass completion percentage] - 3 * [interception percentage]. I can calculate that at any point during the season. In order to calculate the standard deviations from the mean CMI, I like to wait until the season is over (actually, even this can be calculated at any point during the season, but it's a lot simpler for me to just do it at the end of the season - perhaps next year, I can do this after every week during the regular NFL season). For those of you familiar with statistics, the measure of standard deviation from the mean is also called a z-score (or z-value). And, furthermore, z-score can be very easily converted to a percentile rank (assuming that the population is normally distributed. In a later post, I will show that z scores for CMTI or NFL passer rating over the years is distributed normally). The beautiful thing about a percentile rank is that it is always a number between 0 and 100. What's not to like about that!
A quick couple of notes here regarding CMI, and many of the calculations that I will be using from here on out. While I will go through the exercise of creating arduous, complex and sometimes arbitrary (and even unnecessary) calculations, I will strive for simplicity whenever possible when I present my ideas, as I believe they are more likely to be accepted. The use of percentile ranks is an example of this.
Last year, when I first developed CMI, and especially as I looked back in time, I had to figure out how many players to use each year to determine the number of qualifiers. I went through some elaborate mechanisms to calculate the number of passes attempted during the season (per team per game), and some qualifying standard. As you are aware, the NFL uses 14 passes per game as the standard. And yes, while it is simple to use, I am not a big fan of that standard since the average # of passes attempted per game has changed (increased) over time, as you can see from the table below.
The standard today should be closer to 16.
Last year, I arbitrarily assigned a factor close to 50% (with adjustments for the earlier years) to the total # of passes attempted by each team per game to determine the # of qualifiers. I realized this year, that if I simply used the # of teams in the league as the cutoff for determining the # of qualifiers, I get fairly close to my original method. And because it is simple, easy to explain, does a better job (in my opinion, anyway) than the current NFL standard, I will use that as the cutoff. The table below shows the # of qualifiers by season using the NFL standard, my original standard, and my current standard.
As you can see, the # of qualifiers, regardless of which method you select is fairly close in each year, with the exceptions being the earliest years, where the NFL method simply excludes too many passers (in my opinion anyway). Also note that the the AAFC is excluded by the NFL altogether, while the AFL and NFL have been combined in the years 1960-1969 by the NFL. This doesn't make sense to me, since each league played a different # of games (and had a different # of teams). Regardless, if you combine the AFL and NFL results from my method, you get close to the #s used by the NFL. While I think that my method works, I also recognize that this standard may not be the most appropriate for future NFL seasons.
OK, back to the passer ratings.
Because I will discuss other passer rating systems/calculations that are related to CMI in later posts, I will take this moment to re-classify CMI as CMTI (acronym stands for Completions Minus Three times Interceptions). The definition itself hasn't changed - just the acronym.
The table below shows each of the qualifying quarterbacks with their 2009 season's statistics, their NFL passer rating, the percentile rank of their 2009 NFL passer rating (in other words, the converted z-scores), their 2009 rank in terms of NFL passer rating, their 2008 NFL passer rating, the percentile rank of their 2008 NFL passer rating, their 2008 NFL passer rating rank, their 2009 CMTI, 2009 CMTI percentile rank, their 2008 CMTI and 2008 CMTI percentile rank, and their 2008 CMTI ranking, and finally, their average 2-year CMTI percentile rank (again a # between 0 and 100), together with that ranking.
I don't think there's any question as to who the elite quarterbacks are. Also notice the struggles of first-year quarterbacks in each year.
A quick couple of notes here regarding CMI, and many of the calculations that I will be using from here on out. While I will go through the exercise of creating arduous, complex and sometimes arbitrary (and even unnecessary) calculations, I will strive for simplicity whenever possible when I present my ideas, as I believe they are more likely to be accepted. The use of percentile ranks is an example of this.
Last year, when I first developed CMI, and especially as I looked back in time, I had to figure out how many players to use each year to determine the number of qualifiers. I went through some elaborate mechanisms to calculate the number of passes attempted during the season (per team per game), and some qualifying standard. As you are aware, the NFL uses 14 passes per game as the standard. And yes, while it is simple to use, I am not a big fan of that standard since the average # of passes attempted per game has changed (increased) over time, as you can see from the table below.
The standard today should be closer to 16.
Last year, I arbitrarily assigned a factor close to 50% (with adjustments for the earlier years) to the total # of passes attempted by each team per game to determine the # of qualifiers. I realized this year, that if I simply used the # of teams in the league as the cutoff for determining the # of qualifiers, I get fairly close to my original method. And because it is simple, easy to explain, does a better job (in my opinion, anyway) than the current NFL standard, I will use that as the cutoff. The table below shows the # of qualifiers by season using the NFL standard, my original standard, and my current standard.
As you can see, the # of qualifiers, regardless of which method you select is fairly close in each year, with the exceptions being the earliest years, where the NFL method simply excludes too many passers (in my opinion anyway). Also note that the the AAFC is excluded by the NFL altogether, while the AFL and NFL have been combined in the years 1960-1969 by the NFL. This doesn't make sense to me, since each league played a different # of games (and had a different # of teams). Regardless, if you combine the AFL and NFL results from my method, you get close to the #s used by the NFL. While I think that my method works, I also recognize that this standard may not be the most appropriate for future NFL seasons.
OK, back to the passer ratings.
Because I will discuss other passer rating systems/calculations that are related to CMI in later posts, I will take this moment to re-classify CMI as CMTI (acronym stands for Completions Minus Three times Interceptions). The definition itself hasn't changed - just the acronym.
The table below shows each of the qualifying quarterbacks with their 2009 season's statistics, their NFL passer rating, the percentile rank of their 2009 NFL passer rating (in other words, the converted z-scores), their 2009 rank in terms of NFL passer rating, their 2008 NFL passer rating, the percentile rank of their 2008 NFL passer rating, their 2008 NFL passer rating rank, their 2009 CMTI, 2009 CMTI percentile rank, their 2008 CMTI and 2008 CMTI percentile rank, and their 2008 CMTI ranking, and finally, their average 2-year CMTI percentile rank (again a # between 0 and 100), together with that ranking.
I don't think there's any question as to who the elite quarterbacks are. Also notice the struggles of first-year quarterbacks in each year.
Labels:
2008 NFL Season,
2009 NFL Season,
AAFC,
AFL,
CMI,
CMTI,
NFL,
NFL History,
NFL QB Rating,
Normal Distribution,
Passer Rating,
Percentile Ranking,
z-score,
z-value
Subscribe to:
Posts (Atom)


