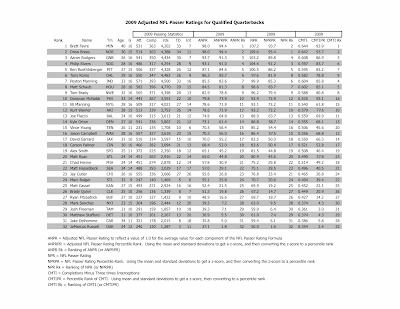
Since we have seen that the average NFL passer rating has increased over time (see my previous post on the topic here), I was curious as to what the average in 2009 looked like, and, more importantly, what would the actual NFL passer ratings have looked like if we adjusted each of the components such that the averages for 2009 were in fact 1.0.
Recall that in the formula , based on data from the 1960's, adjustments are made to each of the four components such that the average for each component worked out to be 1.0. The adjustments, call them k1, k2, k3 and k4, are:
- k1 = 30
- k2 = 3
- k3 = 1
- k4 = 1
Again, these factors were arrived at by looking at data from the 1960's. And, these same factors are applied to the formula regardless of when a quarterback actually played. This has the benefit of course of creating a formula that is the same for all quarterbacks against a fixed standard. The problem of course is when the overall standard changes over time, and this is what has happened over the past 80 years or so.
Well, we don't have to use data from the 1960's. We will use each year as a stand-alone year. So, for 2009, the factors that make each component equal to 1.0 for an average performance turn out to be:
- 2009k1 = 40.90
- 2009k2 = 2.98
- 2009k3 = 1.20
- 2009k4 = 1.78
- 2008k1 = 41.00
- 2008k2 = 2.94
- 2008k3 = 1.28
- 2008k4 = 1.95
- 1969k1 = 32.64
- 1969k2 = 2.99
- 1969k3 = 0.99
- 1969k4 = 1.12
The table below shows the 2009 Adjusted Passer Ratings for the 32 quarterbacks that threw enough passes this past season to qualify. The table also shows their actual 2009 NFL Passer Ratings. You can see that the Adjusted Passer Ratings are clearly lower (as a group) than the actual NFL Passer Ratings. That's because the actual NFL average passer rating in 2009 was 83.0, and, obviously, the average Adjusted Passer Rating for the NFL for 2009 was 66.7 (because we forced it to be so by adjusting the formula such that the average value for each component is equal to 1).
Although the Adjusted Passer Ratings themselves are a lot lower as a group than the actual NFL Passer Ratings, you'll notice that the rankings for each are essentially the same. Why is that? Very simply, since both calculations use the same essential formula with the values changed, all this really does is 'normalize' the actual ratings around a value of 66.7 as opposed to 83.0. And yes, since the relative value of each of the four components now change, there should be some movement in the rankings. Interestingly, I also included my CMTI calculations (and their respective ranks), and it also highly correlates with both the Adjusted Passer Rating rankings and the NFL Passer Rating Rankings.
Just so that you can see for yourself, I've included the table (shown below) that shows the average NFL passer rating by year from 1932 to 2009 using the current NFL passer rating formula (where k1 = 30, k2 = 3 and k3=k4=1 for all years), as well as the adjusted k1-k4 factors for each year. There is no need to show the Adjusted Passer Rating for the NFL in each year, since it is the same in every year - 66.7. If you look at the bottom of the table, for years 1960-1969, you'll see where Don Smith derived his k values from.
Looking at this table you should be able to understand why using the current NFL passer rating system is of little to no use when you need to compare quarterbacks from one era to another. It can truly only be used to compare one passer versus another in any given year, but not across years. It stands to reason then, that the current NFL passer rating formula isn't much use when evaluating a quarterback's career, especially ones who've had a long career (you can see the career NFL passer rating leaders here). In future posts, I will discuss this in more detail.


No comments:
Post a Comment